时间:2024-03-08|浏览:257

用戶喜愛的交易所

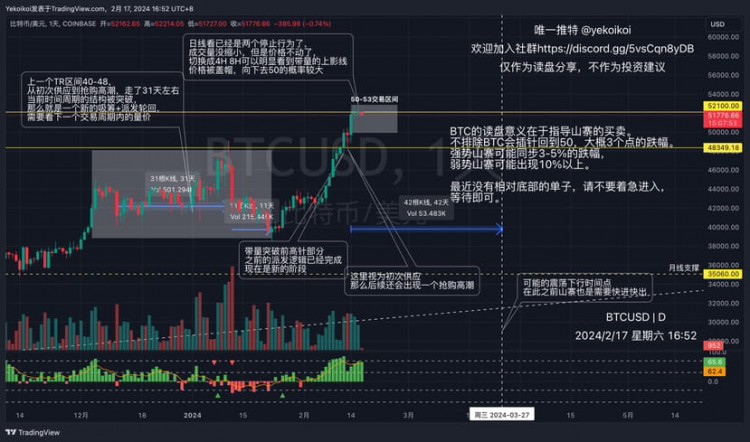
已有账号登陆后会弹出下载
Bitcoin (BTC) set a new all-time high at $69,324 shortly after the opening bell on Wall Street on March 5, before sharply correcting 9.75% to $59,323, which analysts have described as a welcome move before “healthy consolidation” occurs.
BTC/USD daily chart. Source: TradingView Bitcoin price reached “FOMO stage“ above $68,000
Data from Cointelegraph Markets Pro and TradingView showed Bitcoin trading 9% below its new all-time high of $69,170.
While BTC is still up 12% over the last seven days, the pioneer cryptocurrency’s flash crash left market participants wondering where the price will go moving forward.
Market analyst Aksel Kibar shared a chart showing Bitcoin reached above $69,000, calling it the “FOMO stage.”
BTC/USD price chart. Source: Aksel Kibar/X
In a March 4 post on X on March 4, Kibar spotted BTC trading within the $65,000 and $68,000 ranges, heading toward the November 2021 peak of around $69,000. He warned investors not to be caught up in the fear of missing out at that level.
He said,
“$BTCUSD I don't think this is a breakout to an all-time signal. Don’t FOMO this part of the move.”
Head of research at Galaxy Research, Alex Thorn, focused his attention on Bitcoin’s historical price action, particularly in 2020, when it retraced briefly after hitting new all-time highs.
BTC historical price action. Source: Alex Thorn/X
Thorn implied that if history repeats itself, BTC is likely to drop “11.3% lower over 15 days before definitively breaking ATH” again over the next few weeks.
BTC sends a sell signal on the daily chart
The mid to low $50,000s is a possible retracement where a potential dip could occur. On March 2, Peter Brandt shared a chart showing BTC trading in a wide ascending parallel channel with short-term support below $55,000 provided by the pattern’s middle boundary.
“I believe a dip below 55,000 would be a buying opportunity, although such a dip is not my prediction.”
BTC/USD daily chart. Source: Peter Brandt/X
Meanwhile, independent analyst Ali observed that the TD Sequential indicator had sent a sell signal on the daily chart, sending a warning to traders to pay “close attention” shortly before the price crash.
“Boasting a strong track record in predicting $BTC trends since the year’s start, this indicator previously signaled a buy in early January, preceding a 34% surge, and issued a sell in mid-February, followed by a 4.44% downturn.”
BTC/USD chart. Source: @Ali_charts/X
Related: Bitcoin price briefly hits new all-time high with support from BTC ETFs
While other traders expected a deeper correction in a pre-halving retrace, technical price analyst John Bollinger termed the retrace on March 5 in BTC price “a bit much.”
He said,
“We expect profit-taking at new highs; that is the way of things, but this seems a bit much. Is it leverage, weak hands, or something else? In any case, a one-day setback does not make a top.”
Nevertheless, “a failed rally attempt would be ugly,” Bollinger added.
Market data showed traders were poorly positioned for the latest run above $69,000. According to Coinglass data, over $1.17 billion leveraged positions were liquidated across the crypto market in the last 24 hours – $846 million of these being long liquidations. BTC long liquidations totaled $236.33 million.
Bitcoin liquidations. Source: Coinglass
This article does not contain investment advice or recommendations. Every investment and trading move involves risk, and readers should conduct their own research when making a decision.